With SOARVO, data is viewed, uploaded, created and measured all through the map window.
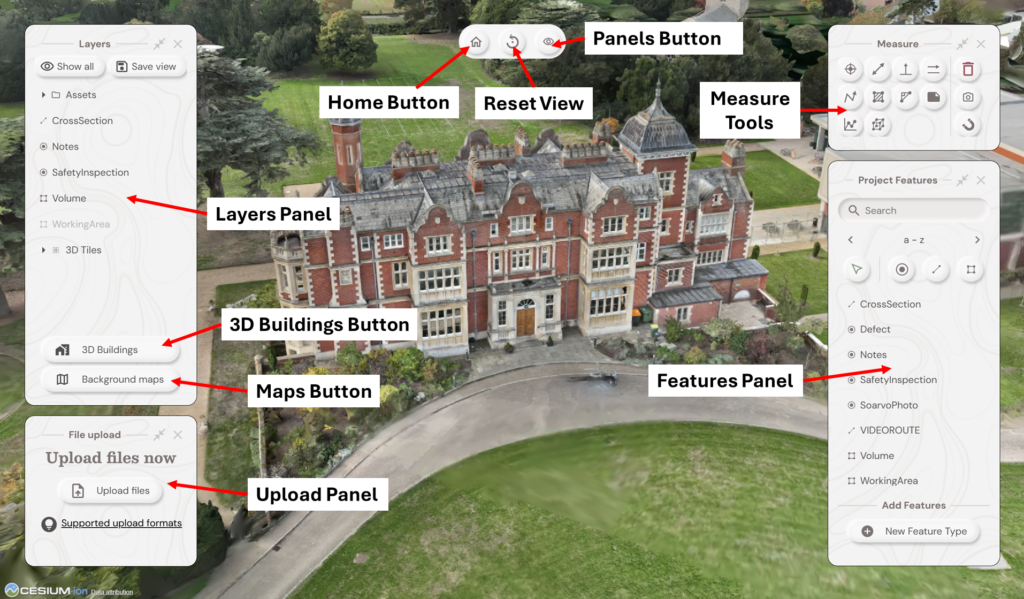
There are several areas to note in the map window
Home Button – return to the home screen
Reset View – resets the view to its starting point
Panel Button – select what Panels are visible on screen
Layers Panel – see what data layers have been loaded and click to view / hide each layer
Upload Panel – click to upload files and view the processing status of your data
Maps Button – click to change the background map display
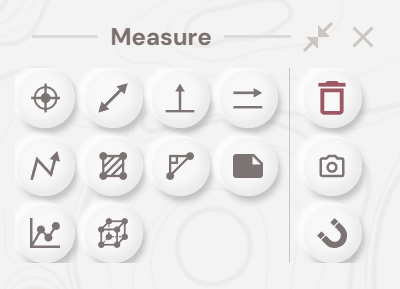
Measure Tools – take measurements within the map window
Features Panel– create new features and select to digitise within the map window
Map Window Controls
PAN – Left Mouse Button – click, hold and move mouse (also Q,Z,A,D on keyboard)
ZOOM – Right Mouse Button – click, hold and move mouse to (also W,S on keyboard)
ROTATE 2D & 3D – Middle Mouse Button or Ctrl + Left Mouse Button – hold Ctrl, click, hold and move mouse (also cursors on keyboard)
Layers Panel
Data imported into a Location will then be shown in the Layers Panel
Data is separated out by type in to groups.
Highlight a layer to change its visibility
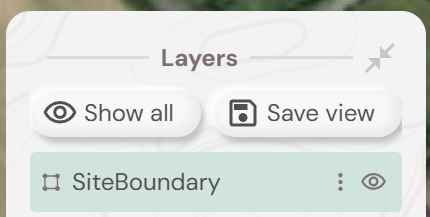
Click the eye logo to change a layers visibility
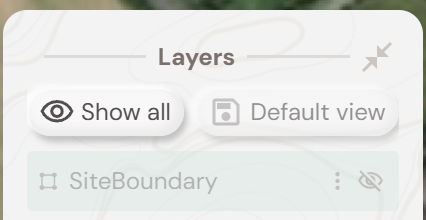
Once you have selected what layers you wish to be displayed by default you can save the view.
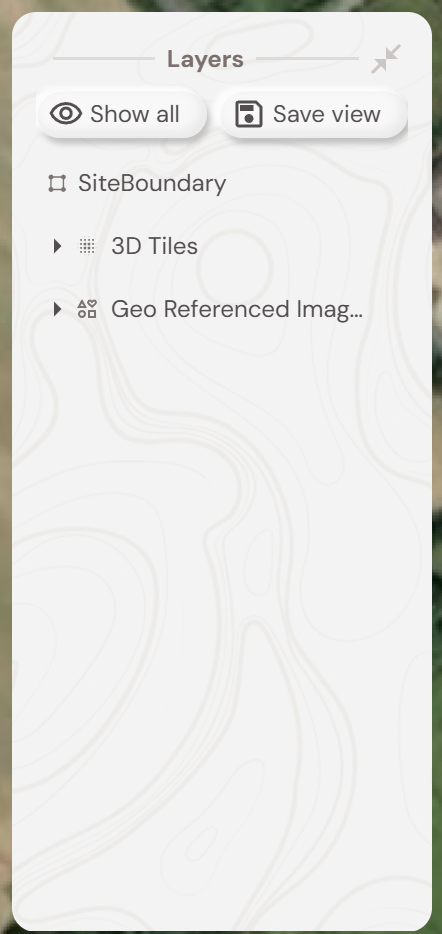
Layer Types
Layers will be grouped by type
Data with “features” such as CSV or SHP data will be displayed individually
Data with 3D elements such as Point Clouds or 3D Meshes will appear in the 3D Tiles Section
Data with 2D elements such as DWGs and Orthomosaics will appear in the Geo Referenced Images Section.
If you have imported any Geo Referenced Images they will generate a Site Boundary to show the extents of the data – this will display as a green box on the map. You can turn the visibility of the Site Boundary off like any other layer.
3D Buildings Button
Toggles on and off the Google 3D Buildings Tileset – note not available for every location
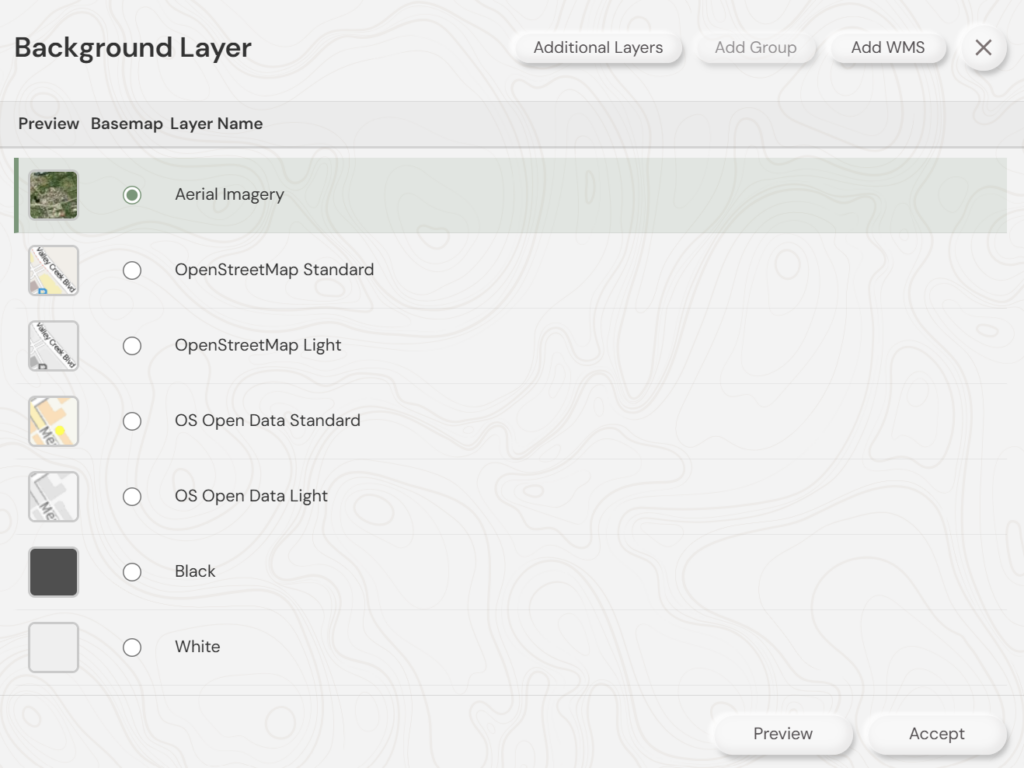
Maps Button
Click to change the map style displayed in the background
Upload Panel
Click Upload Files and browse for the files on your PC to upload.
For instructions on file types and how to upload please see separate Uploading Data into Soarvo article
You will see the progress of the file being uploaded to the system for conversion.
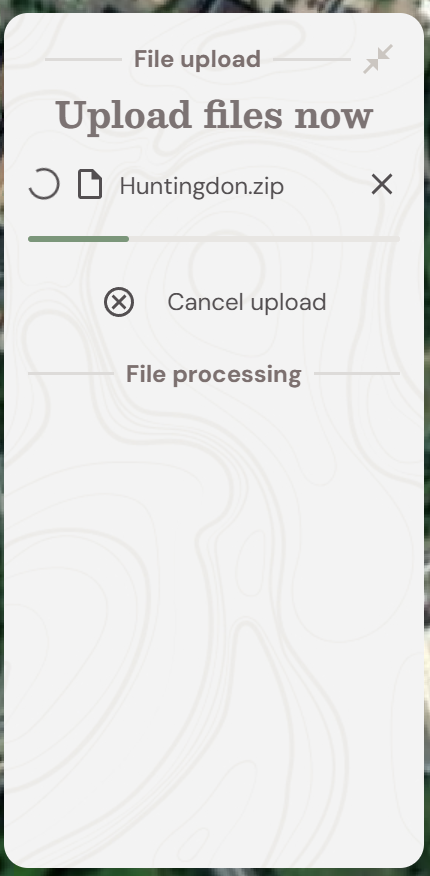
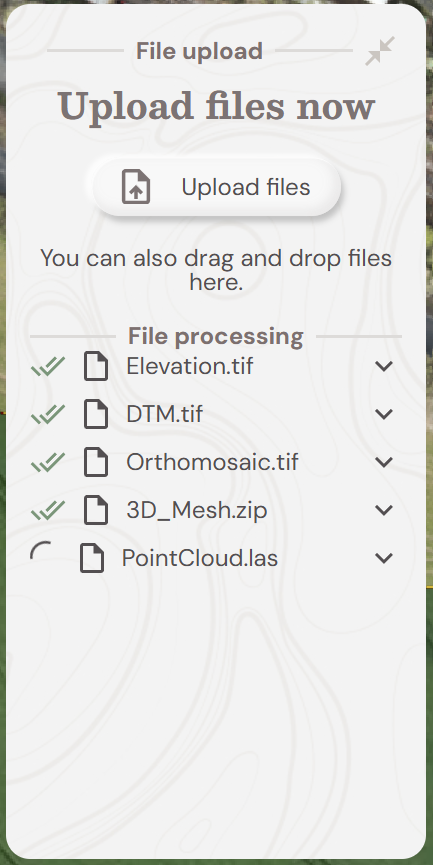
Once the file has been uploaded it will then move to the Processing section of the Upload Panel
It will then notify you with a Green tick once the file is processed or an alert if any errors have occurred.
Home Button
Click to return to the Soarvo home screen
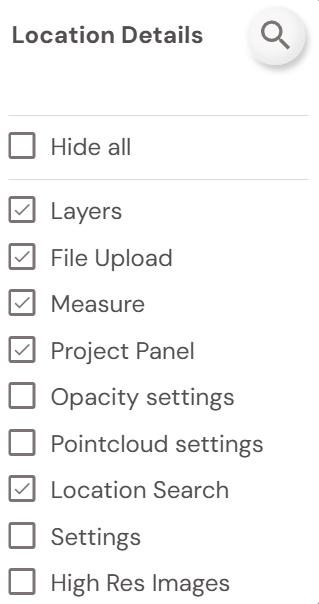
Panel Button
Select which Panels and Buttons are visible on screen, and search by place name, road name, or UK Postcode
Search Button
Click to search for a location on the map
Measure Tools
Click each function to perform a measuring task in the data. Tool Tips in the software explains the measure function for each button
Feature Panels
See separate Feature Library and Creating Features article